ETF returns – What returns can I achieve with ETFs?


Are you looking for a way to invest your money profitably? ETFs (Exchange Traded Funds) can help you achieve your goal! Simple, inexpensive and effective.
They offer you access to the world’s largest markets and reduce risk through diversification. But how much return can you realistically expect? What factors influence your success? And how can you get the most out of your investments?
This article provides all the answers! From calculating ETF returns to practical tips for building your wealth. Let’s find out together how you can make your money work best for you.
In brief:
- ETFs offer an average return of 7 to 9% per year on broad indices such as the MSCI World.
- Costs such as the total expense ratio (TER) affect your net return.
- Long-term investing and the compound interest effect are crucial to your success.
- Thematic ETFs offer greater potential, but also involve greater risks.

Points
Points

Points
Points

Points
Points
Points
Points
Points
Points
Points
Points
Points
Points
Points
Points
Points
0 % without
Points
0 % without
Points
Points
Points
Points
Points
What is the return on ETFs and how is it calculated?
The return on an ETF describes the income you earn on your investment and is a key indicator of its success. It is made up of several components that together make up the total return.
A significant portion of the return comes from price gains. When the stocks in the underlying index increase in value, the price of the ETF also rises. This increase in value is a directly measurable return on your investment.
In addition, many companies pay dividends on a regular basis. These distributions are either paid out directly to you (in the case of distributing ETFs) or automatically reinvested (in the case of accumulating ETFs), thereby increasing your return.
Interest income also plays an important role in bond ETFs. These ETFs contain fixed-income securities such as government or corporate bonds that generate regular interest payments. This income is also included in the total return and supplements price gains and dividends.
Calculating the return is simple and is done using a basic formula:
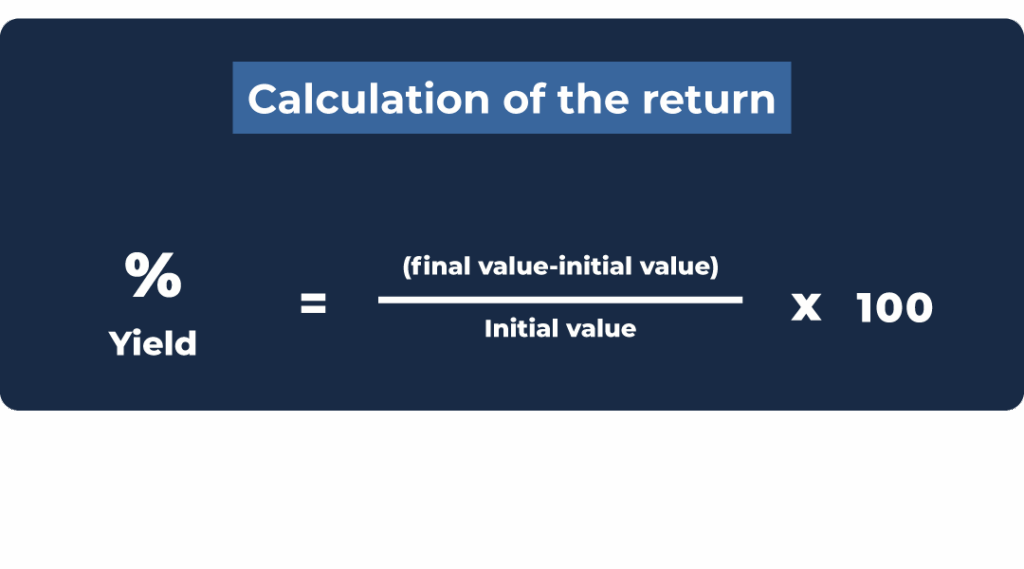
Here’s an example: You invest €1,000 in an ETF, which rises in value to €1,100 after one year. Your profit is €100, which corresponds to a return of 10%. This calculation shows in a simple way how efficiently your money is working for you.
Important terms such as
- Gross return (income before deductions)
- Net return (income after costs and taxes)
- Real return (inflation-adjusted return)
help you to better assess the actual performance of your investment. The return thus gives you a clear insight into how successful your investment strategy is and enables you to make informed decisions for future investments.

What is the average return on ETFs?
The average return on an ETF depends heavily on the index selected and the investment period. Historical data shows that ETFs on global indices such as the MSCI World or the S&P 500 achieve an average annual return of around 7 to 9%.
These figures are based on long-term observations and also take into account turbulent market phases such as financial crises. They therefore offer a realistic assessment of the potential returns over a longer period of time.
Why does the average ETF return fluctuate from year to year?
The return on an ETF is not constant, but is influenced by various factors. One of the main reasons for this is market developments.
During periods of economic strength, prices rise, which increases returns. However, financial crises or events such as the coronavirus pandemic in 2020 can lead to significant, but usually only temporary, declines.
The investment period also plays a major role. Short-term investments are more susceptible to fluctuations, while long-term investments of 10 years or more can offset these.
The choice of index also influences stability: broadly diversified indices such as the MSCI World usually offer a solid basis, while specialised theme ETFs can be subject to greater fluctuations but also promise higher returns.
A look back: average ETF returns
The following table shows the total return and average annual return of the MSCI World Index over various periods.
A look back in time clearly illustrates the importance of a long investment horizon. Data shows that longer-term investments tend to generate more stable annual returns, even if the total return increases over time.
It is important to note that these figures represent historical data and are not a guarantee of future returns.
| Period | Total return (%) | Annual return (%) | Development of €10,000 |
| 5 years | 58,22 | 9,61 | 15.822€ |
| 10 years | 97,62 | 7,05 | 19.762€ |
| 15 years | 257,37 | 8,86 | 35.737€ |
| 20 years | 224,24 | 6,06 | 32.424€ |
| 30 years | 460,01 | 5,89 | 56.001€ |
| 40 years | 1.869,98 | 7,74 | 196.998€ |
| 50 years | 3.434,37 | 7,39 | 353.437€ |
These values show the pure index performance and do not take into account costs such as management fees, taxes or custody fees that would be incurred in a real investment.
The table illustrates the effect of long-term investing and the compound interest effect.

Good to know:
The average return on an ETF is a reliable measure of your long-term investment success. With an investment horizon of at least 10 years, you can weather market fluctuations and achieve solid returns. Long-term investing rewards patience and strategic action.
How much return is realistic with ETFs?
How much return can realistically be achieved with ETFs depends on various factors. In addition to the choice of index, the investment horizon, cost structure and risk appetite also play a decisive role.
Based on historical data and current market developments, the following conclusions can be drawn:
Broad market indices: ETF returns comparison
For broadly diversified indices such as the MSCI World or the S&P 500, long-term data shows the following returns:
- MSCI World: Over the ten years from 2014 to 2023, a sample ETF on the MSCI World (in €) achieved an average return of 11.1% per year. Overall, this resulted in a total return of 187.2% over this period.
- S&P 500: For the period from 2004 to 2023, the average annual return was 10.21%.
It is important to note that these figures represent past performance and are no guarantee of future returns. Experts therefore recommend using conservative assumptions of 7 to 8% per year for long-term planning.

Thematic ETFs and sector bets
Thematic ETFs, which focus on specific sectors or trends, can offer significantly higher returns but also involve greater risks:
- Crypto and blockchain: The VanEck Crypto & Blockchain Innovators UCITS ETF (ISIN: IE00BMDKNW35) has achieved an impressive return of 181.07% over the last 12 months.
- Technology: The WisdomTree Cloud Computing UCITS ETF (ISIN: IE00BJGWQN72) has recorded a return of 30.05% over the last 12 months.
These figures illustrate the high return potential, but also the volatility of such specialised ETFs.
Comparison with other asset classes
In the current market environment (as of December 2024), the outlook for various asset classes is as follows:
| Asset class | Average return |
| Savings account | 0,5 % |
| Call money | 3 to 3,5 % |
| Government bonds | 1,06 to 4,25% |
| equity ETFs | 7 to 9% |
Call money accounts currently offer significantly higher interest rates than in previous years, but still fall short of the long-term returns expected from ETFs. The situation is different for savings accounts, whose returns have not been attractive for decades.

The graph shows the development of interest rates for savings deposits in Germany from 1975 to 2023. The following key points can be derived from this:
- Historical background: In the years prior to the financial crisis, interest rates on savings deposits were at 2% or higher.
- Low interest rate phase: In the wake of the financial and economic crisis, the European Central Bank pursued a low interest rate policy, which was passed on to its customers by commercial banks. This led to a significant decline in interest rates.
- Current situation: In 2023, the average interest rate for savings accounts was around 0.5%.
- Interest rate turnaround: In 2022, high inflation led to an interest rate turnaround, but the impact on savers remained limited.
The chart clearly illustrates the drastic decline in savings interest rates over the last few decades and the persistently low interest rates despite the recent interest rate turnaround.
This makes it all the more surprising that more than a third of the population surveyed in Germany continues to rely on instant access savings accounts or savings accounts. Around a quarter invest in funds and ETFs. Just 13% invest in individual stocks.

Realistic return expectations after costs and inflation
After deducting inflation, taxes and costs, investors can expect real returns of between 2.8% and 3.8%, depending on their equity allocation. This estimate is based on historical returns from stocks and bonds.
ETFs offer attractive long-term return opportunities that significantly exceed the returns of many other asset classes. Broadly diversified ETFs on indices such as the MSCI World or S&P 500 offer a good balance of risk and return, while thematic ETFs can offer higher potential but also greater volatility for risk-tolerant investors.
What factors influence ETF returns?
The return on an ETF is influenced by various key factors that directly or indirectly determine how much of your invested money you will actually receive as profit in the end.
The most important aspects include costs, taxes and inflation. These three areas play a key role in determining your net return and should therefore be carefully considered by every investor.
Costs: The total expense ratio (TER) and more
One key factor that affects your return is the costs associated with your ETF. The total expense ratio (TER) covers all ongoing fees incurred for managing the ETF. These include:
- Administrative costs: Fees for the administration and maintenance of the fund.
- Licence fees: Fees paid for replicating certain indices.
- Distribution costs: Costs incurred in connection with the distribution of the fund.
A low TER, for example 0.2%, has a positive effect on your return, as less of your profits are eaten up by fees.
But be careful: in addition to the TER, there are often other costs that can reduce your return. These include:
- Transaction costs: Fees for buying and selling ETFs.
- Deposit costs: Fees for holding your ETFs with your bank or broker.
You should keep a close eye on these additional costs so as not to unnecessarily reduce your returns. Some brokers, such as Scalable Capital or Trade Republic, offer low-cost or even free ETF savings plans, which can lead to significant savings in the long term.
Taxes: Withholding tax and saver’s allowance
In Germany, gains from capital investments, including ETFs, are subject to withholding tax, which is 25%. In addition, the solidarity surcharge and, if applicable, church tax may apply, which can further increase the tax burden.
An example:
- Without church tax: The flat-rate withholding tax including solidarity surcharge amounts to 26.375%.
- With church tax: The burden increases to around 27–28% depending on the federal state.
Good to know:
Take advantage of the €1,000 tax allowance per person (€2,000 for jointly assessed married couples) to keep part of your profits tax-free. This allows you to effectively reduce your tax burden and keep more of your earnings.
Inflation: Focus on purchasing power
Inflation is an often underestimated factor that affects the return on an ETF. It describes the loss in value of your money over time. Even if your nominal return, i.e. the return before inflation, is 8%, inflation can reduce these gains. An example:
- Nominal return: 8%
- Inflation: 2%
- Real return: 6% (the actual increase in your purchasing power)
However, ETFs offer better protection against inflation in the long term than traditional savings products such as instant access accounts or savings accounts. This is because the performance of ETFs is usually linked to real assets or market indices, which can outperform inflation in the long term.
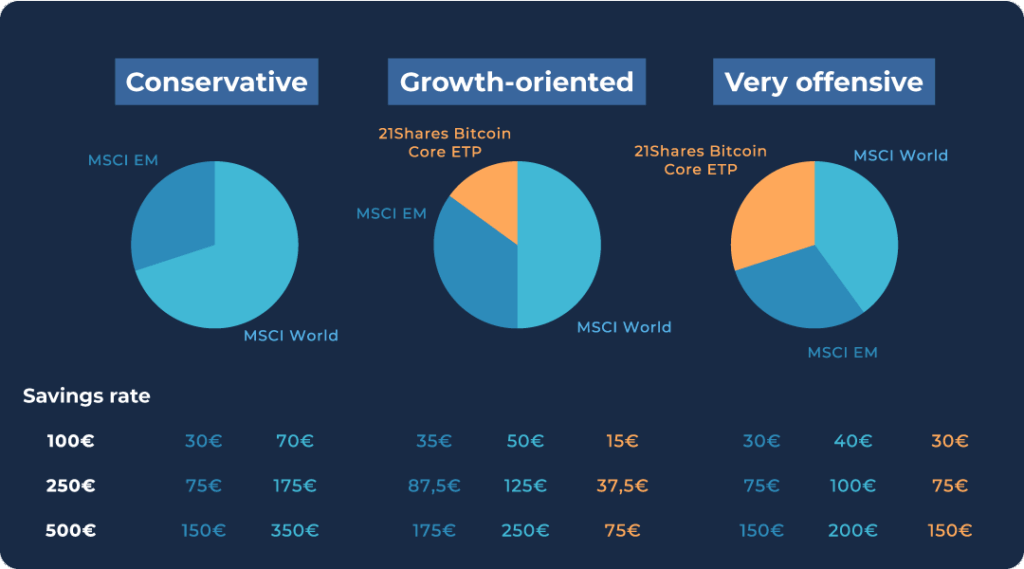
3 sample portfolios with attractive ETF returns
The right portfolio mix is crucial for building your wealth sustainably and efficiently. We present three ETF portfolios as examples that cover different investment objectives and risk profiles.
Whether conservative, growth-oriented or aggressive, each portfolio combines proven ETFs with individual strengths. You will also learn how you can simulate the performance of these portfolios using the Curvo Backtest tool.
Conservative portfolio: stability and security
The conservative portfolio is ideal for investors who want broad diversification and to minimise risk. It consists of:
- 70% MSCI World ETF Example: UBS ETF (IE) MSCI World UCITS ETF (USD) A-dis ISIN: IE00B7KQ7B66 With a total expense ratio of just 0.10%, this ETF is particularly cost-effective. It tracks global stock markets in developed countries and ensures broad diversification. For long-term investors, it is one of the best MSCI World ETFs.
- 30% MSCI Emerging Markets ETF Example: iShares MSCI EM UCITS ETF (Dist) ISIN: IE00B0M63177 This dividend ETF has a TER of 0.18% and invests in emerging markets such as China, India and Brazil. It offers you access to high-potential growth markets. This combination is perfect for a 70/30 portfolio.
This portfolio is ideal for long-term investors who want to combine stable returns with moderate risk. This makes it perfect for ETF retirement planning.
Growth-oriented portfolio: balance between risk and return
The growth-oriented portfolio is suitable for investors who are willing to take on a little more risk in order to achieve higher returns. It is composed of:
- 50% MSCI World ETF ISIN: IE00B7KQ7B66 The MSCI World remains an essential component for ensuring stability and diversification. It can be integrated as an ETF savings plan or as a one-off investment.
- 35 % MSCI Emerging Markets ETF
ISIN: IE00B0M63177
The increased proportion of emerging markets boosts your portfolio’s growth potential. - 15 % 21Shares Bitcoin Core ETP
ISIN: CH1199067674 The Bitcoin Core ETP offers access to the crypto market with a TER of 0.21%. Bitcoin offers high growth potential but is also associated with greater volatility.
This portfolio combines stability and dynamism and is suitable for a medium to long-term investment horizon. An ETF investment strategy like this can help you benefit from a balanced risk/return profile.
Aggressive portfolio: High potential returns
The aggressive portfolio is aimed at risk-tolerant investors who are seeking strong capital growth. The weighting is as follows:
- 40 % MSCI World ETF
ISIN: IE00B7KQ7B66
This ETF will remain as the basis in order to ensure a certain degree of stability. - 30 % MSCI Emerging Markets ETF
ISIN: IE00B0M63177
The proportion of emerging markets remains consistently high in order to benefit from dynamic markets. - 30 % 21Shares Bitcoin Core ETP
ISIN: CH1199067674
With a high proportion of Bitcoin, you can benefit from its long-term return potential. However, you should be aware of its high volatility.
This portfolio is ideal for investors who accept short-term fluctuations in order to achieve high returns in the long term. It is particularly suitable for those who want to tap into modern markets in addition to classic ETFs, for example through platforms such as Scalable Capital reviews or others.
Backtesting-Tool: Curvo Backtest
A crucial step before implementing a portfolio is to analyse its historical performance.
The Curvo backtesting tool allows you to simulate different portfolios and see how they would have performed in the past.
The tool is particularly helpful to:
- Analyse the impact of different weightings (e.g. higher allocations to cryptocurrencies).
- Simulate market conditions such as crashes or boom phases.
- Compare different combinations of ETFs and asset classes.
The backtesting tool is easy to use and gives you a data-driven foundation for making informed decisions. You can try it out right here.
Good to know:
Keep an eye on low costs, optimise your tax strategy and invest for the long term to minimise the impact of inflation. These factors determine how profitable your ETF investments really are.
Conclusion: Average ETF returns – sustainable wealth accumulation made easy
ETFs are a powerful tool for building wealth efficiently over the long term. They offer you access to global markets, an average ETF return of 7% to 9% on broad indices, and the benefits of compound interest.
With a clear strategy, patience and regular saving, you can achieve big goals even with small amounts.
You should always keep an eye on important factors such as costs, taxes and inflation, as these have a significant impact on your net return. Consciously managing your total expense ratio (TER), taking advantage of tax benefits and focusing on broadly diversified indices such as the MSCI World or S&P 500 will help you optimise your investments.
For risk-tolerant investors, thematic ETFs can offer higher returns, but they also involve greater volatility. The key to successful wealth accumulation therefore lies in a balanced portfolio and a long-term investment horizon.
With ETFs, you can put your money to work for you effectively. Secure, diversified and sustainable. Focus on strategic action and benefit from the opportunities offered by the capital market. Your financial future is in your hands!
Start now with an ETF for beginners and secure an attractive ETF return!
Points
Points
Points
Points
Points
Points
Points
Points
Points
Points
Points
Points
Points
Points
Points
Points
Points
0 % without
Points
0 % without
Points
Points
Points
Points
Points
Frequently asked questions (FAQ) about ETF returns

