
ETF Asia comparison: The 9 best ETFs


Many investors strive for a broadly diversified portfolio. In addition to different asset classes, this can also mean geographical diversification. One of the largest markets in the modern global economy is the Asia-Pacific region. The region is growing faster than the global average. With a strengthening economy, investor interest is also growing. Since the market is unfamiliar to many outsiders, funds and ETFs are the instrument of choice here. They ensure that your investment is broadly diversified across the entire market.
In brief:
- The Asian economy is on the rise, with the Middle Kingdom showing enormous economic growth in recent years.
- This naturally arouses interest among many investors, as they want to participate in the growth.
- There are various ETFs available for this purpose, which are worth taking a closer look at.

Points
Points

Points
Points

Points
Points
Points
Points
Points
Points
Points
Points
Points
Points
Points
Points
Points
0 % without
Points
0 % without
Points
Points
Points
Points
Points
Facts about the Asian economy
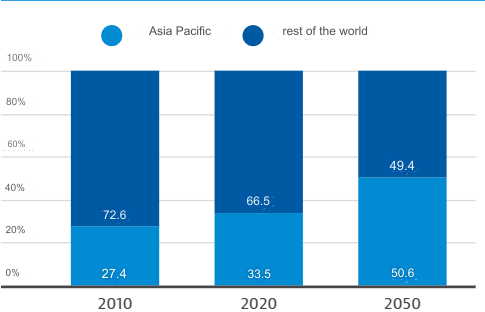
The economy in the Asia-Pacific region has grown significantly in importance over the past few decades. The region is growing at an above-average rate compared to other regions worldwide and, according to forecasts by the Asian Development Bank (ADB), is expected to contribute half of global gross domestic product by 2050. The potential arising from these forecasts and circumstances should be obvious to every investor.
It is also interesting to note that this enormous economic growth is not solely attributable to China’s economic power. According to the ABD, in 2022, Asian developing countries excluding China grew faster than China for the first time in 30 years. India clearly stands out in this regard. According to forecasts, the country’s economy is expected to grow by 6.6 per cent.

Key sales and procurement markets
As we examine the various ETFs and their respective focuses in the following articles, we will also look at the markets in which the companies operate. It has long been no secret that Asia is a major market for goods. The countries of the Association of Southeast Asian Nations (ASEAN) are also considered promising procurement markets for Germany.
The share of exports from Asian countries to Germany is also rising steadily. While exports to Asia fell sharply during the coronavirus pandemic, in 2021 goods transport exceeded pre-crisis levels, and in 2022 the value of German imports was more than 45 per cent higher than in the pre-pandemic year of 2019.
Further facts about Asia compared to the USA
Asia is one of the most exciting continents when it comes to the economy and economic growth. Major powers such as China and Russia, but also the emerging economies mentioned above, such as India, and smaller countries present an interesting picture for interested investors. Further facts about Asia in comparison to the United States:
| Asia | USA | |
| Inhabitants | 4.463 billion | 333.3 million |
| Area km² | 44.580.000 km² | 9.834.000 km² |
| Countries | 47 | – |
| Gross domestic product (GDP) 2014) | 4.850 billion US dollars | 23.594,05 |
| Forecast regional growth for 2024 | 4,5 % | 2,7 % |
| Share of economic growth (forecast) | 60 % | 15,56 % |

Key stock indices for investing in Asia
As we will explain in more detail shortly, stock indices play an immensely important role in the formation of ETFs. They are essentially used to form ETFs, but more on that later.
There are various indices that are particularly important in the Asian region. We would like to introduce these to you.
1. MCSI Emerging Markets Total Return Net Asia Index
This ETF is a free float-adjusted, market capitalisation-weighted index that reflects the performance of Asian stock markets on a total return basis with net dividends reinvested.
The index tracks the country indices of China, India, Indonesia, Korea, Malaysia, Pakistan, the Philippines, Taiwan and Thailand.
2. MSCI AC Asia ex Japan Index
It comprises the 50 largest Asian equities, excluding Japan (“ex Japan”).
3. MSCI AC Far East ex Japan Index
This index provides access to equities from the developed and emerging economies of East Asia. Here too, Japan is once again excluded. The economies must meet certain criteria in terms of size, liquidity and free float market capitalisation. East Asia excludes India. The index is weighted according to free float market capitalisation.
Good to know:
Free float market capitalisation is simply another term for free float, i.e. the proportion of shares that are available for regular trading on the stock exchange and are not held by major investors.
4. MSCI Pacific ex Japan
As the name suggests, this index extends beyond Japan’s borders. It tracks the performance of the stock markets of industrialised countries in the Pacific region. Again, Japan is not included. The companies in the index have high and medium market capitalisation. The following countries are represented: Australia, Hong Kong, New Zealand and Singapore.
5. Dow Jones Asia/Pacific Select Dividend 30 Index
This index is structured slightly differently. It measures the performance of the 30 stocks with the highest dividend yields in eligible countries in the Asia-Pacific region.
Here is a summary of the most important information about investing in Asian stock indices in table form:
| Index | Region | Country | Number of titles | KBV | KGV | DIv yield |
| MSCI EN Asia | Asia | – | 112 | 3,64 | 20,11 | 1,65 |
| MSCI AC Far East Ex Japan NR USD | Asia (excluding Japan) | – | 553 | 1,38 | 12,48 | 3,29 |
| MSCI Pacific (ex Japan) | Asia-Pacific (excluding Japan) | – | 126 | 1,63 | 14,69 | 4,64 |
| DJ Asia Pac Select Dividend 50 | Asia-Pacific | – | 62 | 0,76 | 10,46 | 6,60 |
Explanation: Number of stocks = How many shares are included in the respective index
P/B ratio = Indicates whether shares are undervalued or overvalued and compares a company’s book value to its stock market price. The lower the P/B ratio, the more company substance investors receive for the price they pay on the stock market.
P/E ratio = Current share price divided by earnings per share. The lower the ratio, the cheaper the share is valued.
Div yield = Indicates the percentage return on a share in the form of dividends in relation to the current share price.
Comparison of the 9 most important ETFs for Asia
So now we have arrived at the big comparison of the different ETFs. The ETFs that you are about to learn about were examined and compared with each other based on four different criteria:
- TER in %:
The abbreviation TER stands for ‘total expense ratio’. It refers to the ongoing costs of the respective ETF that you have to pay. If you decide to invest in one of the ETFs, this fee will not be deducted from your account separately, but will be offset against your deposit amount. You simply invest a little less.
- Distribution
The return on ETFs can be paid out either as accumulated or distributed. If the ETF is designated as accumulated, you do not receive the return; instead, it is reinvested directly in the ETF and benefits from the effect of compound interest. With the distributed option, you receive the return in your payout account.
- Replication type
A distinction is made here between synthetic and physical replication. Physical replication is also referred to as full replication. This means that the ETF invests in all companies listed in the index in exactly the percentage specified in the index. However, this concept reaches its limits with very large indices. For this reason, there is also synthetic replication. In this case, the ETF enters into a swap transaction with a financial institution, which undertakes to deliver the index return in return for a fee.
- Volume in € million
The traded volume of the respective ETF.
Here is the comparison:
| ETF name | TER in % | Distribution | Replication type | Volume in € million |
| iShares Core MSC Emerging Markets | 0,18 | No | Physical | 20.000 |
| Amundi MSI Emerging Markets Asia | 0,20 | No | Synthetic | 834 |
| Vanguard FTSE Developed Asia Pacific ex Japan | 0,15 | Yes | Physical | 1.484 |
| xTrackers MSCI All Country Asia ex Japan Swap | 0,65 | No | Synthetic | 321 |
| iShares Asia Pacific Dividend | 0,59 | Yes | Physical | 376 |
| iShares Asia Property Yield | 0,59 | Yes | Physical | 522 |
| xTrackers MSCI China | 0,65 | No | Physical | 1.160 |
| iShares MSCI China A | 0,40 | No | Physical | 2.369 |
| xTrackers FTSE China 50 | 0,60 | No | Physical | 173 |
To give you an accurate picture of the various ETFs, here is a brief overview of each ETF, along with a graph showing its price performance over the last five years.
iShares Core MSCI Emerging Markets
A classic Asian investment! Although it covers emerging markets around the world, this ETF contains 71% Asian equities. China is the most heavily represented country, accounting for over 40%.
At €18 billion, this is a huge fund that made many investors happy last year with a return of 8.2%. With costs of only 0.18%, it is also inexpensive:
The tracking difference is even lower than this figure. With this probably best-known of all Asia ETFs, dividends are reinvested directly. It can also be purchased from all well-known brokers.
Amundi MSI Emerging Markets Asia
Our next candidate invests exclusively in Asia. In addition to China, which is a natural choice, Korea, Taiwan, Thailand, India, Malaysia and Indonesia are also included. Russia, although geographically part of the same continent, is not included here.
The Amundi product could therefore be a good fit for many investors’ plans. After all, the very high return of 16.5% last year and the low costs of 0.2% are also impressive.
Here, too, dividend income is reinvested. However, the index tracking of this ETF is somewhat less accurate, resulting in a tracking difference of 0.6%. Although it is quite common and considered safe, the tracking of shares via swaps must also be mentioned.
Vanguard ETFS Developed Asia Pacific ex Japan
Those who are not interested in Japan but would like to include Australia and New Zealand in their portfolio would be well advised to consider the Vanguard Developed Asia Pacific ex Japan fund. The latter two countries offer significantly lower volatility than emerging markets.
This can have a stabilising effect on the portfolio and appeal to some investors. The investment in Australia, Korea, Hong Kong, Singapore and New Zealand costs only 0.15%, has a good tracking difference of 0.18% and most recently generated a return of 9%.
xTrackers MSCI All Country Asia ex Japan Swap
The next option for Asia enthusiasts is the All Country Asia ex Japan ETF from xTrackers. It invests in developed and emerging markets excluding Japan and includes China, Taiwan, South Korea, Hong Kong, India, Singapore, Thailand, Malaysia, Indonesia and the Philippines.
This very broad and therefore attractive diversification comes at a fairly high price of 0.65%, and the tracking difference is also 0.79%. To compensate, however, there was a great return of 12.9% most recently.
iShares Asia Pacific Dividend
The first candidate on our list that appeals to dividend hunters is the Asia Pacific Dividend from iShares. This fund invests in companies from the Asia-Pacific region that boast high profit distributions.
This ETF is limited to 50 stocks found in developed countries in the region. Most recently, it achieved a dividend yield of 4% with costs of 0.59% and a tracking difference of 0.3%.
As with other dividend ETFs, however, the past year was very painful, resulting in a loss of 17.2%.
iShares Asia Property Yield
Asia Property Yield is an exotic addition to the Asia ETFs series, as it invests exclusively in Asian real estate companies in the form of real estate investment trusts. This method currently yields a dividend of 3.34%.
Here too, significant losses were recorded last year, with a loss of 16.6%. Costs currently stand at 0.59 per cent and the tracking difference at 0.5 per cent.
xTrackers MSCI China
Let us now turn to ETFs that focus exclusively on the Chinese market. The MSCI China from xTrackers achieves this by investing in Hong Kong stocks and explicitly excludes Shanghai and Shenzhen, for example.
This includes well-known names such as Alibaba and Tencent, which explains the strong return of 16.7% most recently. However, the costs are also slightly higher at 0.65 per cent and the tracking difference is 0.73 per cent.
iShares MSCI China A
The counterpart to the aforementioned China ETF is the MSCI China A from iShares, as it only invests in the Shanghai and Shenzhen stock exchanges. This index tends to include more traditional companies rather than modern technology firms.
This strategy has paid off handsomely, ultimately generating an enormous 28.3% return for investors. With costs of 0.4% and a tracking difference of minus 0.9%, most investors are likely to be equally satisfied.
xTrackers FTSE China 50
Our last candidate can be described as the Chinese version of the DAX: it buys shares in China’s 50 largest companies and therefore also contains many well-known stocks. Unfortunately, it is limited to the Hong Kong stock exchange and therefore does not accurately reflect the Chinese market.
The return was therefore correspondingly poor: only 0.06 per cent was generated here. So almost nothing has changed here. With costs of 0.6 per cent and a tracking difference of 0.64 per cent, this is a less attractive China ETF overall.
Savings plans for Asia
The most popular way to invest in ETFs, especially among younger people, is through a so-called ETF savings plan. With these, you set a monthly amount with the broker of your choice and this is automatically invested for you.
This has the advantage, of course, that you can track Asia’s economic development over the longer term. Different brokers offer different terms and conditions for saving via a savings plan.
The three most cost-effective platforms that also allow you to invest in Asian markets are Trade Republic and Scalable Capital.
Both offer different advantages in terms of their stock exchange location and price structure:
| Freedom24 | Scalable Capital | Trade Republic | |
| Deposit management | Free of charge | Free of charge | Free of charge |
| Order fees | €0,2 + €0,02 (per azione) | Gettext € 0,99; XETRA €3,99; 0’01 % (min. € 1,50) | LS Exchange 1€ |
| ETF and share savings plans | Not possible | Free of charge | Free of charge |
| Number of shares | 40.000 | 8.000 | 9.000 |
| Number of ETFs | 1.500 | 2.500 | 2.400 |
| Number of ETFs and savings plans | 0 | 2.500 | 1.900 |
| Start bonus | Freedom 24 bonus Free shares worth €79–€529 (until 31 December 2024) | Scalable Capital Bonus No bonus currently available | Trade Republic Bonus No bonus currently available |
| Review | Freedom 24 review | Scalable Capital review | Trade Republic review |
Which provider you ultimately choose is entirely up to you.
Conclusion: Asian ETFs are ideal for diversifying your portfolio.
The economic situation in Asia is attracting the attention of many investors. The strong economic growth of recent decades and the prospect of further economic growth sound promising. With their broad-based and diversified characteristics, ETFs offer the ideal means of investing in this growing economy.
Various indices reflect the Asian economy from different perspectives. The respective ETFs offer different terms and conditions. Which one you choose is entirely up to you.
You may also be interested in the topics ‘ETF comparison’ or ‘Investment strategy’.
FAQ – Frequently asked questions

